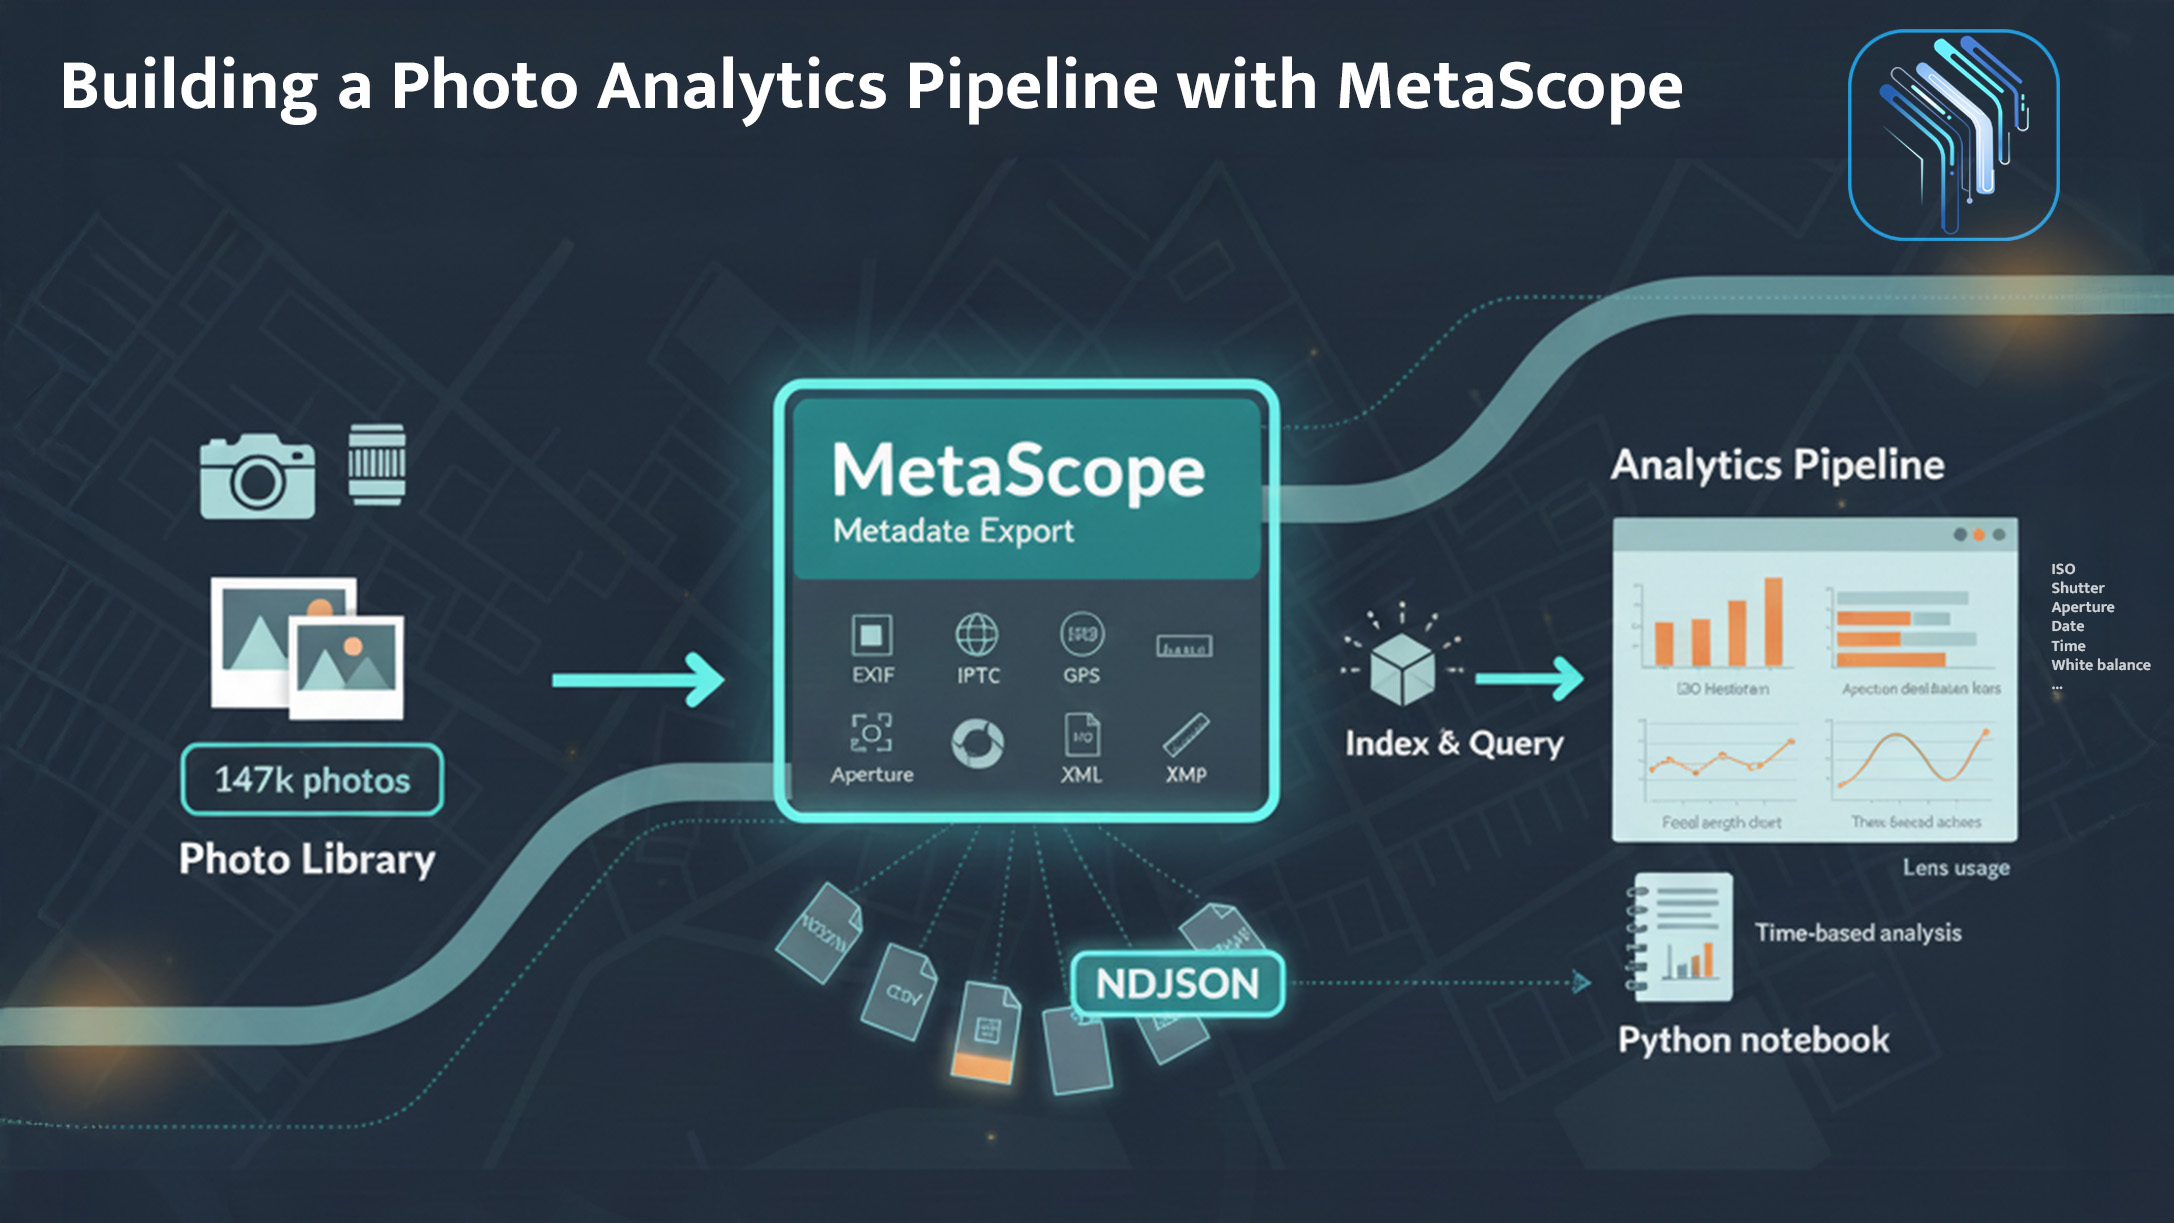
Building a Photo Analytics Pipeline with MetaScope
Export your metadata to Elasticsearch, analyze shooting patterns in Python, and discover what your data reveals about your photography.
After years of shooting, you might have questions that no photo management tool can answer:
- What’s your most-used focal length by subject type, not just overall?
- How has your ISO usage evolved as camera sensors improved?
- When do you actually shoot? What days, what hours, what seasons?
- Which lens-camera combinations produce your highest-rated work?
Lightroom shows basic stats. But for real analysis, you need your metadata outside of photo software, in formats that data tools understand.
Here’s how MetaScope bridges that gap.
Nine Export Formats: The Right Tool for Every Job
MetaScope supports nine metadata export formats. Each serves a different purpose in an analytics pipeline.
The Formats
| Format | Extension | Best For |
|---|---|---|
| JSON | .json | Python/JavaScript analysis, API ingestion |
| NDJSON | .ndjson | Elasticsearch, streaming processors, large datasets |
| CSV | .csv | Excel, Google Sheets, quick analysis |
| XML | .xml | Legacy systems, enterprise integration |
| YAML | .yaml | Configuration files, human-readable archives |
| HTML | .html | Web display, shareable reports |
| Markdown | .md | Documentation, GitHub, note-taking |
| Text | .txt | Simple archival, quick inspection |
| XMP | .xmp | Adobe sidecar files, Lightroom sync |
NDJSON → Elasticsearch Pipeline
For serious analysis, export as NDJSON (Newline-Delimited JSON): one JSON object per line, no array wrapper.
Why NDJSON?
- Streaming-friendly: Process 100,000 records without loading everything into memory
- Elasticsearch-native: Bulk import with a single command
- Line-based: Easy to grep, head, tail, filter with Unix tools
- Append-friendly: Add new records without parsing existing file
Example workflow:
# MetaScope exports to photography-metadata.ndjson
# Then bulk import to Elasticsearch:
curl -XPOST "localhost:9200/photos/_bulk" \
  -H "Content-Type: application/x-ndjson" \
  --data-binary @photography-metadata.ndjson
Now you can query your photo metadata with the full power of Elasticsearch: aggregations, faceted search, time-series analysis.
CSV for Quick Exploration
When you just want to poke around in a spreadsheet, CSV is unbeatable.
MetaScope’s CSV export is RFC 4180 compliant with configurable options:
- Delimiter: Comma (default), tab, or semicolon
- Headers: Include or exclude column headers
- Categories: Export all fields or select specific categories
Export to CSV, open in Google Sheets, and within minutes you’re building pivot tables and charts.
JSON for Python Scripts
For custom analysis scripts, structured JSON is easiest to work with:
import json

with open('metadata-export.json') as f:
    photos = json.load(f)

# Average ISO by camera model
from collections import defaultdict
iso_by_camera = defaultdict(list)

for photo in photos:
    if photo.get('iso') and photo.get('cameraModel'):
        iso_by_camera[photo['cameraModel']].append(photo['iso'])

for camera, isos in iso_by_camera.items():
    print(f"{camera}: avg ISO {sum(isos)/len(isos):.0f}")
MetaScope’s JSON export is properly structured with:
- All fields at top level (flat structure option)
- Or organized by category (hierarchical structure option)
- Alphabetically sorted keys (optional, for consistent diffs)
The Analytics Dashboard: Built-in Insights
Before exporting for heavy analysis, MetaScope’s Analytics Dashboard answers common questions instantly.
ISO Distribution
A histogram showing how often each ISO range is used:
ISO 100     ████████████████████████  32%
ISO 200     ████████████████          22%
ISO 400     ████████████              16%
ISO 800     ████████                  11%
ISO 1600    ████                       6%
ISO 3200    ███                        4%
ISO 6400+   █████████                  9%
Insight: More high-ISO than expected? Good thing you upgraded to a camera with better low-light performance.
Aperture Distribution
f/1.4       ████                       5%
f/2         ████████████              15%
f/2.8       ████████████████████████  31%
f/4         ████████████████          21%
f/5.6       ████████                  11%
f/8         ████████                  10%
f/11+       ████                       7%
Insight: f/2.8 dominates? Makes sense for event photographers who need speed without total background obliteration.
Focal Length Distribution
<24mm       ████                       6%
24-35mm     ████████████████          22%
35-50mm     ████████████████████████  35%
50-85mm     ████████████              17%
85-135mm    ████████                  12%
135-200mm   ████                       5%
200mm+      ██                         3%
Insight: 35-50mm dominates. The “normal” range is called that for a reason. Maybe investing in a really good 50mm prime makes more sense than zooms.
Photos Over Time: The Timeline
A monthly timeline showing when shooting happens:
        Jan Feb Mar Apr May Jun Jul Aug Sep Oct Nov Dec
2022    ▃   ▃   ▅   ▇   ▇   ▇   █   █   ▇   ▅   ▃   ▃
2023    ▃   ▃   ▅   ▇   █   █   █   █   █   ▇   ▅   ▃
2024    ▃   ▅   ▇   █   █   -   -   -   -   -   -   -
Insight: Way more shooting in summer. Wedding season? Better weather? Both, probably. Winter becomes editing season.
Top 10 Cameras
1. Canon EOS R5          ████████████████████  28.5%
2. Canon EOS R6          ████████████          17.2%
3. Canon EOS 5D IV       ████████              11.4%
4. iPhone 14 Pro         ██████                 8.9%
5. Sony A7III            █████                  7.3%
...
Insight: Almost 9% iPhone? Those “I don’t have my camera but…” moments add up.
Top 10 Lenses
1. Canon RF 24-70mm f/2.8       ████████████████  22.1%
2. Canon RF 70-200mm f/2.8     █████████████     18.3%
3. Canon EF 50mm f/1.2         ████████           11.5%
4. Canon RF 35mm f/1.8         ██████              8.7%
5. Canon RF 85mm f/1.2         █████               7.2%
...
Insight: Zoom lenses for flexibility, but that 50mm f/1.2 gets more use than realized. That prime is earning its keep.
Summary Stats
At a glance:
- Total images: 147,283
- Unique cameras: 12
- Unique lenses: 24
- GPS-tagged: 89,412 (61%)
- Date range: Jan 2015 – Dec 2024
- Average ISO: 640
- Average aperture: f/4.2
- Average focal length: 52mm
Building the Full Pipeline
Here’s a complete analytics setup for the data-curious photographer.
Step 1: Export from MetaScope
Export the entire library as NDJSON:
- Format: NDJSON (for Elasticsearch)
- Fields: All categories enabled
- Options: Include technical, descriptive, creator, rights, location, workflow
File size for 147,000 images: ~180MB
Step 2: Import to Elasticsearch
# Create index with proper mappings
curl -XPUT "localhost:9200/photos" -H "Content-Type: application/json" -d '{
  "mappings": {
    "properties": {
      "dateTaken": { "type": "date" },
      "iso": { "type": "integer" },
      "aperture": { "type": "float" },
      "focalLength": { "type": "float" },
      "cameraModel": { "type": "keyword" },
      "lensModel": { "type": "keyword" },
      "gpsLatitude": { "type": "float" },
      "gpsLongitude": { "type": "float" }
    }
  }
}'

# Bulk import
curl -XPOST "localhost:9200/photos/_bulk" \
  --data-binary @metadata-export.ndjson
Step 3: Query Anything
Now you can answer questions that no photo app supports:
“What’s the average ISO when shooting with the 70-200mm?”
GET photos/_search
{
  "query": { "match": { "lensModel": "70-200" } },
  "aggs": { "avg_iso": { "avg": { "field": "iso" } } }
}
Result: 1,247. Makes sense: long lens = more reach = more indoor/low-light sports.
“How many photos per month, grouped by camera?”
GET photos/_search
{
  "size": 0,
  "aggs": {
    "by_month": {
      "date_histogram": { "field": "dateTaken", "calendar_interval": "month" },
      "aggs": {
        "by_camera": { "terms": { "field": "cameraModel" } }
      }
    }
  }
}
“Where have I shot most frequently?” (with GPS data)
GET photos/_search
{
  "size": 0,
  "aggs": {
    "locations": {
      "geohash_grid": { "field": "location", "precision": 5 }
    }
  }
}
Step 4: Visualize in Kibana
Import the Elasticsearch data into Kibana and build dashboards:
- Time series: Photos per month, stacked by camera
- Pie chart: Lens usage distribution
- Heat map: Geographic shooting density
- Line chart: Average ISO trend over years (watching sensor tech improve)
Step 5: Python for Custom Analysis
For questions Kibana can’t answer, pull into Python:
import pandas as pd
from elasticsearch import Elasticsearch

es = Elasticsearch()
results = es.search(index="photos", size=10000, body={"query": {"match_all": {}}})
df = pd.DataFrame([hit['_source'] for hit in results['hits']['hits']])

# Correlation: rating vs. technical settings
print(df[['rating', 'iso', 'aperture', 'focalLength']].corr())

# Highest-rated focal lengths
high_rated = df[df['rating'] >= 4]
print(high_rated.groupby('focalLength')['rating'].mean().sort_values(ascending=False))
What the Data Can Reveal
Building this kind of pipeline reveals patterns that are otherwise invisible:
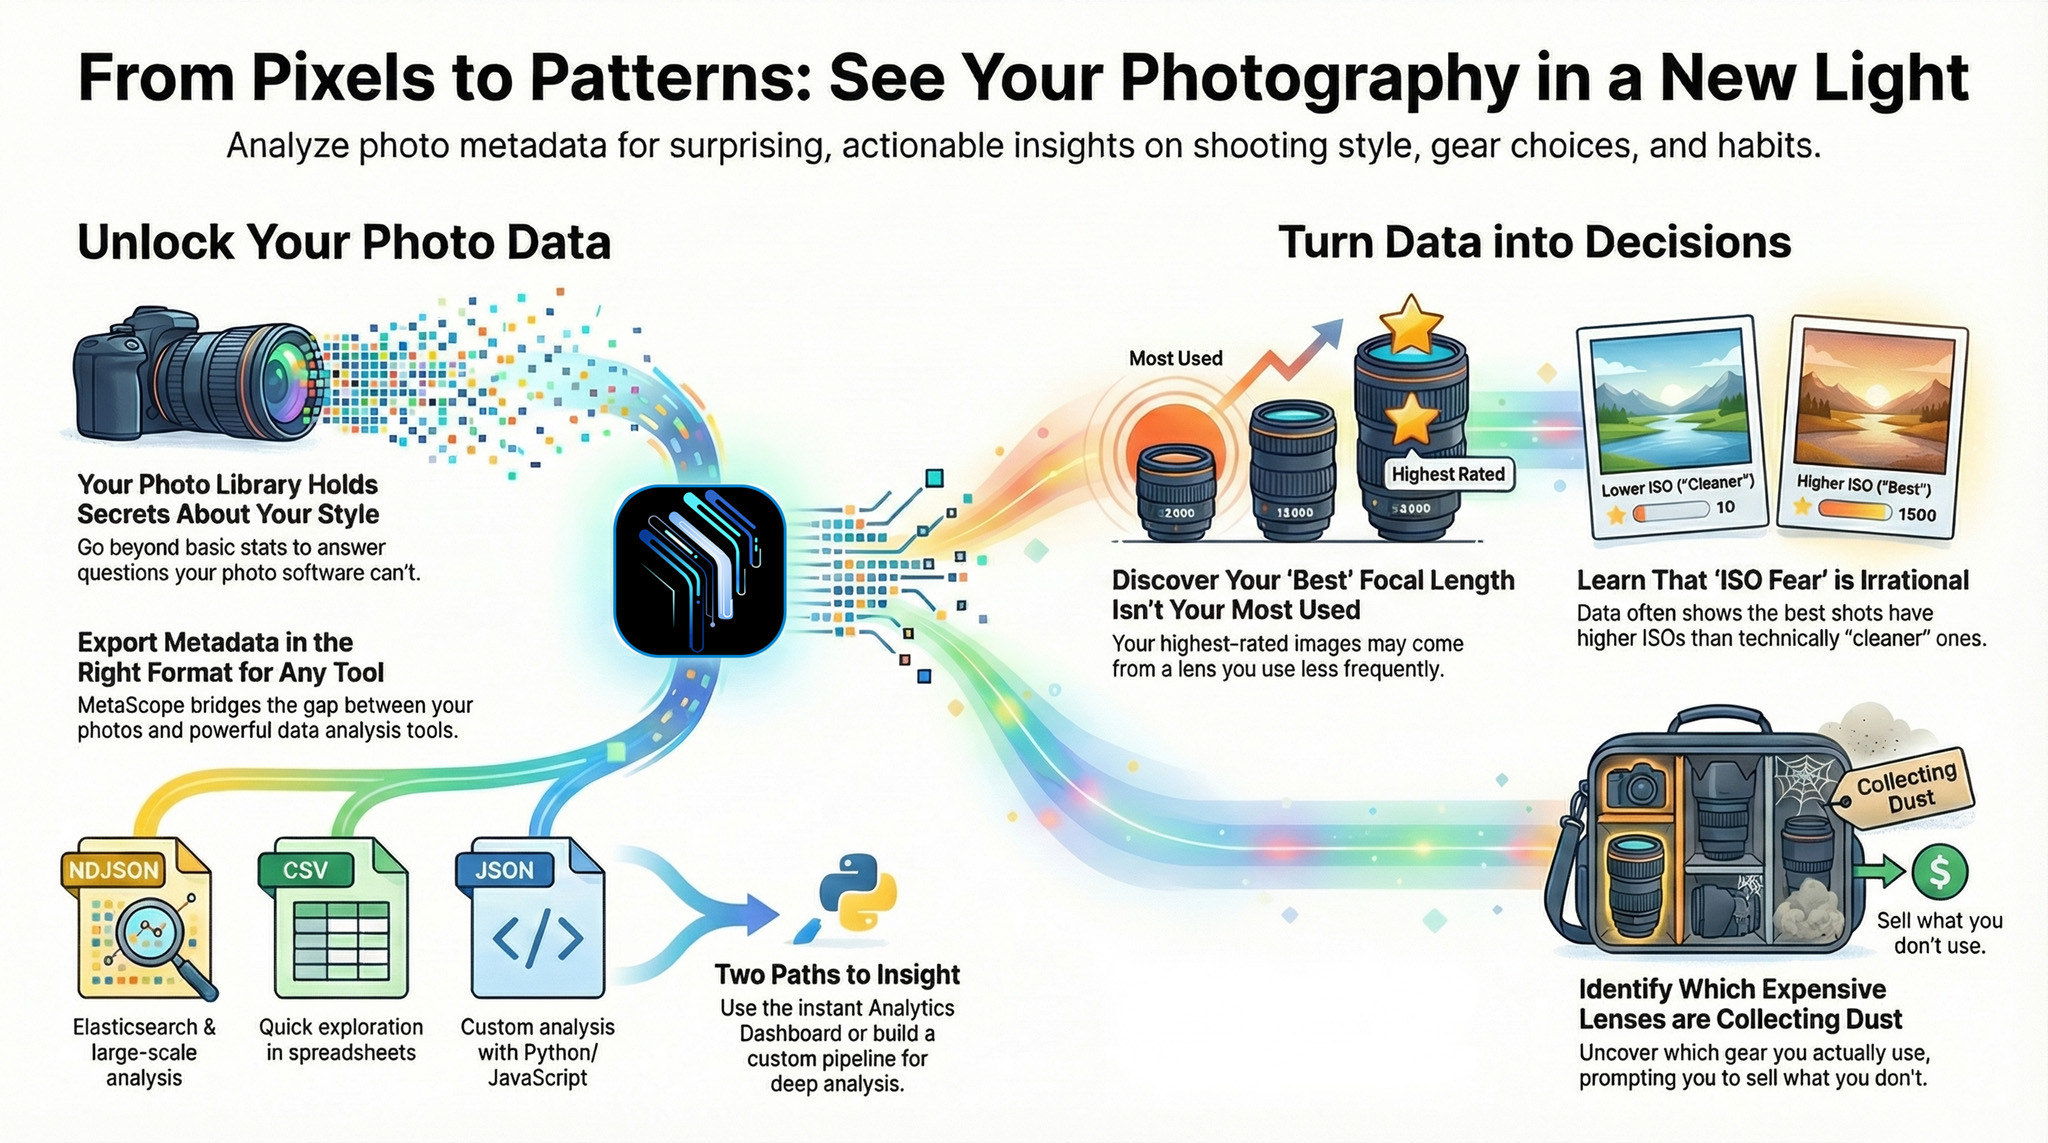
1. Your “Best” Focal Length Isn’t What You Think
Most-used focal length might be 35-50mm (normal zoom range). But highest-rated images might cluster around 85-135mm. The telephoto compression you thought was “occasional” might produce your best work.
Action: Invest in a premium portrait-length prime.
2. Morning vs. Evening Shooting
Extracting hour-of-day from timestamps might show 40% of photos taken before noon, even if you think you’re an “evening light” photographer. Data says otherwise.
Action: Schedule more sunrise shoots.
3. ISO Fear Is Irrational
Photos rated 4-5 stars might average ISO 1,100. Photos rated 1-2 stars might average ISO 400. Higher ISO (capturing the moment) beats lower ISO (technically “better” settings) when it comes to results.
Action: Stop hesitating to push ISO. The shot matters more than the noise.
4. Some Lenses Are Collecting Dust
Data might show a lens hasn’t been used in 18 months. Meanwhile, an inexpensive lens accounts for 9% of shots.
Action: Sell the unused lens. Buy accessories for what you actually use.
Export Configuration Tips
For Data Analysis (NDJSON/JSON)
- Enable all categories - you can always filter later, but you can’t recover fields you didn’t export
- Use flat structure - easier to work with in pandas/dataframes
- Sort keys alphabetically - makes git diffs cleaner if you version your exports
For Spreadsheets (CSV)
- Use tab delimiter - handles commas in descriptions better
- Include headers - essential for column identification
- Select relevant categories only - 104 columns is overwhelming; choose Technical + Descriptive for most analyses
For Archives (XML/YAML)
- Include document metadata - creation date, export date, version info
- Enable section headers - better organization in hierarchical formats
- Pretty print with proper indentation - future-you will thank present-you
For the Non-Data-Scientists
Not everyone wants to set up Elasticsearch. That’s fine. MetaScope’s built-in Analytics Dashboard answers the most common questions without any setup:
- ISO, aperture, focal length distributions
- Photos over time
- Top cameras and lenses
- Summary statistics
Export to CSV for deeper analysis in Excel. Export to JSON for a one-off Python script. The pipeline can be as simple or complex as your curiosity demands.
The data is there. MetaScope gets it out. What you do with it is up to you.
The Unexpected Benefit
This kind of analysis isn’t just about answering questions. It’s about understanding your own style.
Before analytics, photography style lives in vague terms. “I like natural light.” “I prefer wider apertures.” “I shoot a lot of events.”
After: You know you shoot 31% at f/2.8. You know your sweet spot is 35-85mm. You know you shoot 40% more in summer. You know your highest-rated work uses telephoto compression.
Data doesn’t replace artistic intuition. But it illuminates patterns that are otherwise invisible.
MetaScope supports nine export formats including NDJSON for Elasticsearch integration. The Analytics Dashboard is available in both free and Pro tiers. Batch export of large libraries requires Pro.